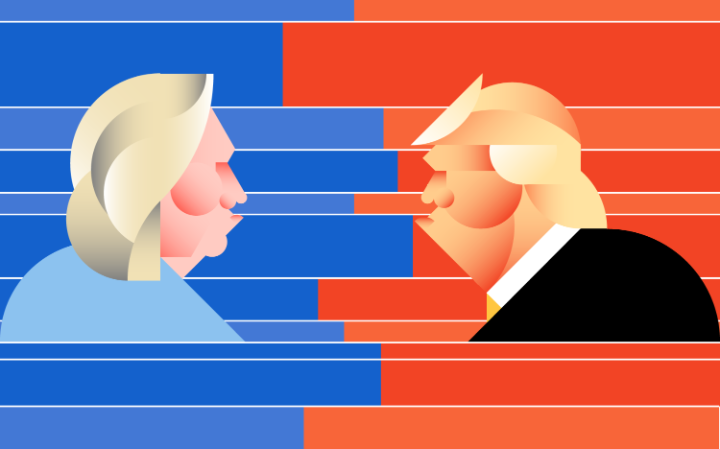
All over the world, the failure of pollsters to predict Trump’s election victory is being scrutinised. The problem goes beyond methodology: we need new questions, new ways of interpreting data, and a new narrative.
In yesterday’s post, I called for a substantial overhaul of our practices of data consumption after the failure to predict Donald Trump and his victory. I did not go as far as others who, at least in one high-profile case, claimed that “data died.” But as more information about polling emerges and pre-election reporting is being scrutinized the world over, a number of factors are becoming increasingly clear which we should take note of when doing quantitative research in the future.
First, we need much better questions. On paper, everybody may agree that data is only as good as the questions that are going into it in the first place, but in practice, this has not been observed. Says Nate Silver, “In the average state won by Trump, the polls missed by an average of 7.4 percentage points.” This points to a fundamental misunderstanding of very large parts of the American electorate, and it is not just a matter of turnout among White working-class voters:
- Donald Trump was said to have poor chances among Latino voters because of his attacks on “them.” Yes, he displayed xenophobic tendencies, and he did not mind being endorsed by racists. But his attacks were specifically targeted at Mexicans and at illegal immigrants. Many Latinos in the United States are not Mexicans, nor of Mexican descent, nor are they illegal immigrants. Many pollsters did not take sufficient account of anti-Mexican sentiment among certain Latino communities, and of their pride in their own successful path to U.S. citizenship.
- Another example is women, and this is going to sound painful: A very large number of women seem to think that you can do worse as their elected representative than boast about “grabbing pussy.” You and I may not agree; but Donald Trump got a lot of women’s votes, and researchers struggle to explain this.
- Similarly, according to poll after poll, voters said that they did not think Donald Trump was qualified to be president, or that they despised him. Yes, even a fair number of these people must have voted for him – and not just against Hillary Clinton, as many commentators made us believe.
Second, we need to get better at constructing a narrative out of the data that we have in front of us. This is a call issued also by Democratic researcher, Stanley Greenberg, who says that the main problem with election forecasts was with the “interpretation of the polls.”
Donald Trump is being depicted by some as the face of the new America; his election, as a rejection of the old elites by the poor.
Well.
At inauguration he will be the oldest person ever to have served as president – in 240 years. Equally, his voters are older than Clinton’s. We see the same age distribution among his electorate as we saw among the Brexiters: the older you are, the more likely you are to vote Trump (or Brexit). In both these cases, babyboomers or even their parents are saying no to the world their children call home, and they succeed at putting it at risk.
Another misreading of the available data is that it’s the people at the lower end of the income scale who put Trump in power. It is not (if that data is correct!). It is people who earn upwards of $50,000. So these are people who do have an income and who have had a professional career and who have been able to navigate the economic troubles of the last decade or two, although it is becoming increasingly difficult for them to continue. While this gets mentioned here and there now, it is a big story that needs to be explored in detail, and it’s uncomfortable – not because Trump’s voters are so different from the chattering classes but precisely because they are more similar than expected.
So I do not mean to say that quantitative research as such is in crisis. But it needs to be put in proper context.


